European primes' captured share of their accessible upstream launch and manufacturing market rose from 33 to 65 per cent in 2025, per ESA's 2026 Space Economy Report. Space Insights.
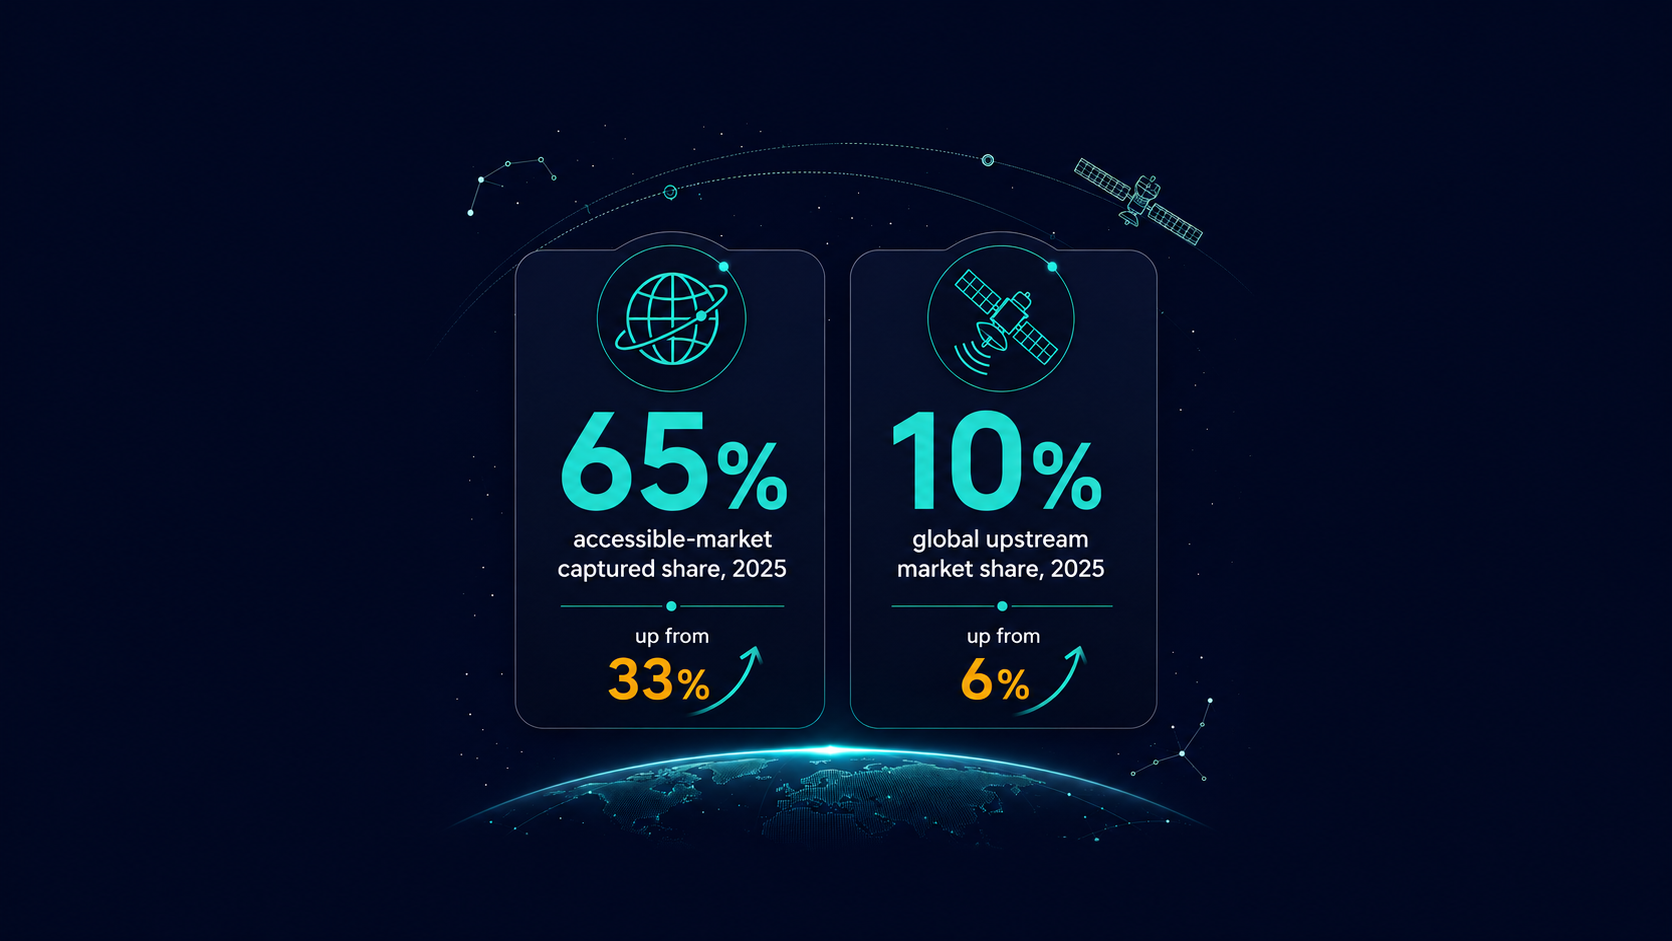
Global public space budgets fell 3 per cent in 2025, to €119 billion — a decline ESA attributes primarily to a cut in US defence spending and flat NASA funding, and which it describes, in its own characterisation, as marking the end of the past decade's double-digit annual growth rate. Europe's own consolidated public budget rose 12 per cent, to €13.5 billion. Both figures led this month's coverage of ESA's 2026 Space Economy Report. A third indicator, which received less attention, may matter more for how the European space industry actually competes: European primes' captured share of the global upstream launch and manufacturing market accessible to them rose from 33 per cent in 2024 to 65 per cent in 2025, reversing four consecutive years of decline.
What the report's headline numbers actually say
Defence now accounts for 53 per cent of global public institutional space budgets. Europe's consolidated space budget — covering national programmes, ESA (including Third Party activities), Eumetsat and the EU Space Programme — grew 12 per cent to €13.5 billion, an increase led by higher German national defence spending. Europe's share of the global public space budget rose to 11 per cent, from 10 per cent in 2024, while the United States remained the largest single funder at 58 per cent.
Private investment tells a starker story. Global private investment in space ventures reached an all-time high of €11.7 billion in 2025, up 60 per cent — but that growth was almost entirely a US phenomenon, with American space ventures raising nearly €8 billion, up 177 per cent year on year. European space ventures raised just above €1.4 billion, down 8 per cent from 2024, through 88 deals. When acquisition-driven distortions from the prior year are removed, European private investment excluding acquisitions actually rose 10 per cent year on year — a detail the headline decline figure obscures.
What "accessible market" means, and why the 65 per cent figure matters
More than 80 per cent of the global launch and manufacturing market value is structurally inaccessible to European primes, closed off by captive institutional demand — chiefly US and Chinese defence and human spaceflight programmes — and by vertically integrated constellations such as Starlink. "Accessible market" here does not mean a European domestic market; it means the portion of the global market, wherever the customer sits, that is genuinely open to competition rather than captured by these structural barriers.
Within that accessible portion, European primes' captured share rose sharply: from 33 per cent in 2024 to 65 per cent in 2025, reversing a declining trend that had run since the early 2020s. Europe's overall share of the total global upstream market, accessible or not, rose to 10 per cent, from 6 per cent in 2024. The report's underlying accounting method assigns a spacecraft's or launch's full estimated value to the year it launches, rather than spreading it across the years revenue is actually recognised; this is standard practice for the indicator, but it means the figures show a marked one-year improvement in launch-year market indicators, not a directly measured change in won contracts, order backlogs or company-level sales for any given year.
How the defence dimension complicates the reading
Defence dominates much of global institutional upstream demand, and the same dynamic underpins Europe's 2025 budget growth. The report does not disaggregate how much of Europe's improved captured-market share came specifically from defence contracts, as against civil institutional or commercial demand, so the 65 per cent figure should be read as a whole-of-market result rather than evidence for any specific driver. Whether the improvement reflects a broader structural shift, or simply the particular mix and timing of spacecraft launched in 2025, is not something a single annual observation can settle.
What remains uncertain
The report itself cautions that annual upstream data should be read with care, given the launch-year accounting method described above. Whether the 2025 rebound in Europe's accessible-market captured share persists, reverts, or reflects a one-year composition effect is a question next year's edition will help answer; this year's figures alone cannot resolve it.
What to watch
Next year's edition of the report will show whether the captured-share rebound continues or reverts, and whether Europe's private investment recovers now that 2024's acquisition-driven distortion has cycled out of the year-on-year comparison. Germany's defence-space investment plans and France's National Space Strategy, both cited elsewhere in the report as drivers of Europe's 2025 budget growth, are the national-level commitments most likely to determine which way the 2026 figures move.
Related signals - European Parliament SEDE committee exchange of views on EUSPA's future defence role (Space Insights, this week) - Germany's €35 billion space security and defence investment plan by 2030 - France's National Space Strategy 2025 to 2040, announced November 2025
Sources
- 1.ESA releases 2026 Space Economy Report — European Space Agency
- 2.Evolution of Europe's competitiveness in the upstream segment of the space market — European Space Agency
- 3.According to ESA, European space budgets rose 12% in 2025 — Agence Europe
- 4.Governments Around the World Spent €119B in Space Last Year, ESA's Space Economy Report Reveals — SpaceWatch.Global
- 5.ESA report highlights Europe's growing role in the global space economy — Innovation News Network
Get briefings like this every Friday.
Subscribe